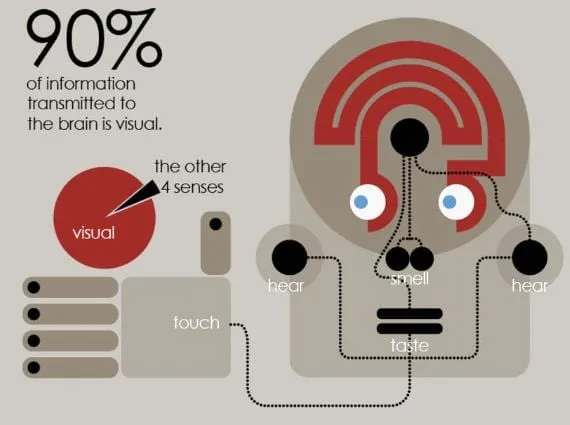
Humans are visual creatures. Some of the first ways we codified our thoughts about the world around us were through visuals (i.e., cave drawings). Even today, thousands of years after the first cave drawings were used to communicate with others, we still prefer to use visual mediums over wordy-content.
Studies have shown that visual content increases information retention rate by 29%-42% in different populations. Another study showed that combining words with visual imagery results in an 85% recall rate 3 hours after shared information. The same study proved a 65% recall rate even 3 days after the information was first shared, when visuals were combined with words. In comparison, the 3-day mark retention was a mere 10% when only words were used.
From a marketing perspective, this is great news. Brands now have a way to get their message across – and ensure information retention – to targeted customers. In particular, using visual content can now help brands target those markets, where word-based digital content was ineffective. The possibilities are endless, right from a better brand image on social media to more organic website traffic to higher rate of conversion.
In this research report, we’ll take a look at the visual digital marketing statistics and trends for 2020 and 2021. Using these insights, brands can plan their visual digital marketing more effectively and pave the way for commercial success.
Visual digital marketing: General statistics
(Source: Content Marketing Institute)
· A greater chunk of content accounts for visuals
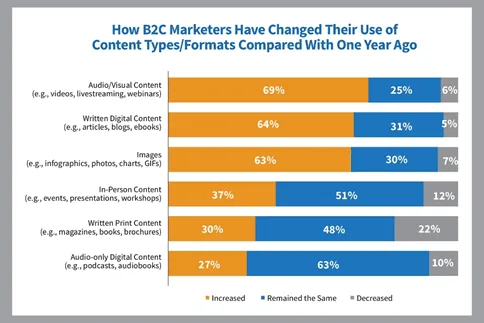
Prior to 2019, only 63% of surveyed companies used some form of visual imagery in their articles and blogposts. But today, more than 80% of companies include visual digital marketing content in the mix.
· Some marketers spend up to 20 hours each week producing visual content
Research shows that in the 2019-2020 period, 28% of marketers spent less than 2 hours each week to produce visual content. 22% spent 2-5 hours and another 22% spent 5-10 hours on creating visual digital materials. Only 9% devoted 10-20 hours to this task and around 11% of brands spent a whopping 20 hours each week to create visual digital content.
· Marketers have increased investment in visual digital marketing, but they intend to invest more
Compared to the time prior to 2019, around 31% of surveyed brands restricted visual marketing spending to 1%-10% of their marketing budget. But, after 2019, there has been a steady increase in the number of brands who are spending more on visual content marketing.
Research indicates that 43% of companies have started investing between 11% & 30% in visual content creation. Additionally, at least 12% of the surveyed companies plan to spend 41%-50% of their marketing budget on visual digital content in the coming years.
Image marketing statistics
When we talk about images in visual digital content marketing, we include stock photos, screenshots & memes.
(Source: Visme)
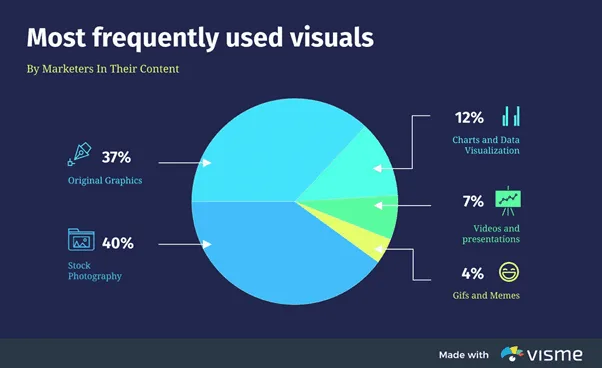
· Stock photos are the most-used visual digital content in the world today
For 83% of customers, the image used on a blog post or on the shopping site, determine whether they’ll purchase the product or not. (In fact, a blogpost with an image every 75-100 words has double the rate of engagement, than posts that don’t have as many images.) In comparison, only 36% of customers consider videos during the final stages of decision making, when they’re browsing for products.
This is why marketers use images a lot in their visual digital marketing. In particular, 40% of companies rely completely on stock photos, because of the superior quality of the photos. Additionally, brands state that the easy availability of stock photos for all niches of business, makes them a low-effort and high-yield choice.
· Memes are used the least, but they’re also one of the most effective image formats
Memes and GIFs are used by less than 4% of all brands today. But the brands that do use them hail from the big leagues. Whether its Netflix’s sassy replies to customers or Gucci’s tradition-breaking new-age meme-art or Disney’s cutesy puns, there are plenty of takers for memes. In fact, memes and GIFs are becoming a great way for legacy brands to connect with an entirely new set of millennial customers and become more relevant.
· Site visitors spend about 5.94 seconds viewing the images on your site
Did you know that site visitors read only 20% of your website? Of this, according to a study by Google, customers spend almost 6 seconds seeing the images on your webpage/site. However, they make a decision about your worth, within 50 milliseconds of visiting your site and seeing your overall visual appeal.
Research shows that for most customers, the visual appeal i.e., the type of images you have used, their quality, their understandability and their conformance with other visual design elements, matter more than site usability and navigation.
Video marketing statistics
When we talk of videos, we refer to both static videos and live videos.

(Source: FinancesOnline)
· Videos have the ability to generate 300% more traffic than other forms of content
Did you know that by the year 2022, 82% of all internet users will stream more video content than other forms of content? Already, YouTube has over 2 billion active users today, second only to Facebook. 55% of all YouTube viewers watch videos on the platform every day.
Video is expected to bring in so much web traffic, that brands are forecasted to invest over $100 billion for in-video digital ads by 2023.
· Over 59% of customers watch a video to get product information
When it comes to learning about a product or service, customers would rather watch a video than read an article. In fact, 41% of Boomers, 60% of Gen Xers and 70% of millennials prefer to buy from brands that show product/service videos, than from brands that don’t do the same.
This is why 36.7% of companies are posting fresh video content monthly and 24.3% of brands post weekly video content. This strategy has helped companies, with 81% of marketers confirming that video content has increased time visitors spend on their website.
(Source: Social Media Examiner)
· Social videos generate 12X more shares than traditional videos
Social media video marketing is immensely powerful. 64% of all social media users say they are more-likely to purchase from a brand, after they see a branded video on social media.
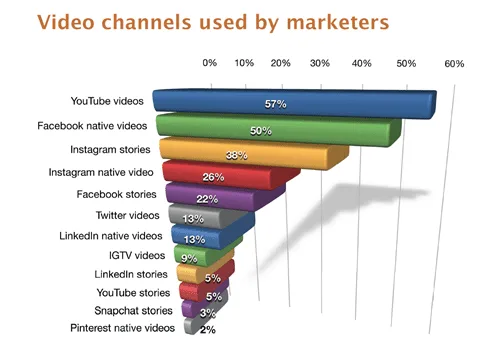
Facebook native videos in particular, have 10X higher reach than other social videos. Consumption of Facebook videos is so high, that Facebook executives believe that by the end of 2021, Facebook will support predominantly video content and not text.
Other social media platforms perform well too. For example, did you know that videos on Twitter are 6X more-likely to be re-tweeted than images and 3X more than GIFs? Instagram stories and IGTV are also popular choice amongst marketers, given their 23.86% video engagement rate (which is much higher than YouTube’s 4%).
· Viewers watched over 12.7 billion hours of live videos in the 2019-2020 period and this is forecasted to increase
Live videos have become increasingly popular these days. While YouTube Live and Facebook Live used to be the go-to platforms for live streaming, in 2020 platforms like Twitch and Instagram Live have also gained prominence.
The most-watched live streams are real-time news coverages, followed by concerts and business conferences. 87% of viewers love to watch behind-the-scenes videos and expert interviews by companies. In fact, live videos are so popular that 45% of customers would be willing to pay for on-demand live content from brands.
Forecasts indicate that in 2021, the live streaming market will be worth over $70 billion. Especially during the coronavirus pandemic era, when travelling is an impossibility for many, live videos will become the best way to indulge in a near-travelling experience.
Additionally, most video streaming will occur on mobile, since 85% of adults consume video content in multiple devices.
Infographics marketing statistics
· People who use infographics for information are 28% more-likely to have their questions/doubts answered
Surveys across industries shows that infographics are a great way to share information with people. For example, researchers were seen to spend 39% lesser time looking for data, when they used infographics.
Similarly, infographics help people understand information better too. Hospital patients were 2.84X more-likely to understand their diagnosis better and 1.24X likely to remember and understand their treatments.
· 67% of B2B marketers use infographics regularly
Did you know that it takes a mere 150 milliseconds for visual information to be processed and another 100 milliseconds to get meaning out of it? When these visuals are created using the right colors, shapes and fonts, it becomes easier for the viewer to understand the content.
Infographics combine colors, shapes, animations and words, in a seamless manner. Given how technical many B2B products and services tend to be, infographics become a great way to simplify information. In fact, 67% of all B2B marketers leverage infographics, graphs and charts for their digital marketing. They’re easy to make and very effective in generating site visits, leads and conversions.
Top 5 visual digital marketing trends to look out for in 2021
Now that we’ve discussed key visual digital content statistics, let’s take a look at the 5 visual content trends that’ll rule the roost in 2021.
· Micro stock images will be in huge demand in 2021
Micro stock images are stock images that are priced in the $1-$5 range. According to research on the global still images market, 2021 will see a rise in demand for royalty-free micro stock images.
The reason stems from the increasing number of start-ups and SME businesses which are implementing visual digital marketing. Despite the covid19 pandemic, the world has seen a booming entrepreneurial spirit, with more new companies being formed. Especially online service providers such as e-grocers, e-pharmacists, e-librarians etc. These companies with shoestring budgets require premium-quality, authentic and non-copyright images that can resonate with their target market. Micro stock images can fill this requirement, without putting cash-strapped businesses at financial risk.
Demand for micro stock is so high, that forecasts indicate that the stock photo industry will generate a revenue of $4.43 Billion by 2025.
· 360-degree photos and videos will be preferred over conventional visual material
360-degree photos and videos are visual content that allow viewers to see the 360-degree perspective of a product, place or service. These videos and photos employ Virtual Reality and Augmented Reality to create an immersive experience where the audience can move the product/service around and see it from multiple directions and angles. Good examples are Seeker VR’s “Journey To The Edge Of Space” and images from 360cities.net.
Studies show that 360-degree videos receive twice the number of clicks and have a 14% higher conversion rate, than conventional videos. Similarly, 360-degree images see an increase in conversion by 22%, plus, they lead to a reduction in product returns by 35%.
In the 2019-2020 period, a few companies were exploring the concept of 360-degree images and videos. Mostly, these brands belonged to the technology and gaming industry. With the Covid19 pandemic, 360-degree videos and photos were employed in edutainment products as well.
Now, in 2021, more industries are expected to adopt 360-degree images and videos into their marketing.

(The Landing Page Highway Infographic – Source: Uplers)
· Interactive infographics will become more-popular than static infographics
Take The Guardian’s “Gay rights in the US, state by state” or Visme’s “Bagel, Poodle and Q: Surprising Trends in Dog Names” or Tabletop Whale’s “Explaining ventilators for COVID-19” for example. They’re all examples of interactive infographics.
These clickable and engaging infographics are already gaining a lot of ground these days. But in 2021, we’ll see adoption of interactive infographics increase.
Compared to static infographics, interactive infographics are much nicer to look at. They don’t passively serve information to readers, but allow us to explore the sections of the infographic that we’d actually like to know about. This makes the visual content highly-personal. Plus, when it comes to aesthetics, interactive infographics are more-engaging than static infographics.
· Shoppable videos will take over social media
Already shopping advertisements across social media channels; from Facebook ads to Instagram shopping posts to YouTube’s embedded ads. But in 2021, a new type of advertisement will be joining their ranks – the shoppable video.
Shoppable videos are visual content, that focus on creating a wonderful aesthetic experience for the viewer and very subtly promote the brand’s shopping links. Consider El Corte Ingles’ shoppable video depicting their new range of women’s clothing. It’s very visually-appealing and unintrusive. They can be used on social media to direct viewers to the brand’s website, so they can learn more about the content of the video.
· Image Optimization will take center stage to meet Google’s page experience requirements
In late 2020, Google announced that it would be evaluating websites and pages based on a stringent set of page experience metrics, such as page load times, safe browsing, number of intrusive interstitials, device-specific layout optimization etc. Those sites which meet these requirements will be ranked high on the search engine.
One aspect that affects adherence to page experience metrics, is image size. Image optimization will allow brands to improve page load speed, provide higher-quality site design aesthetics and ensure that images are both desktop and mobile-optimized. Image optimization will also focus on bettering image SEO, such as alt text, keyword-optimized names & captions and image sitemaps. Together, this will enable brands to deliver better visual content and site experience to visitors.
Wrapping up
The forecasts for visual digital content marketing look very promising, for the year 2021 and beyond. Companies can use visual digital content without worry, to generate higher site visits and conversions.